Plotly is a visualization tool used widely for visualization of data in different kind of charts. It is easy to use and charts can be created with just a few lines of code. One can build dashboards using data with less ui and dashboard development knowledge using plotly. Plotly offers different kind of visualization charts like bar, line, pie, scatter and many other visualization options. We can also use it for visualization of results from Machine Learning models. For details on all options provided by plotly, you can view on this url.
If you have not installed plotly, you can install it using pip or conda.
pip install plotly

# or using conda
conda install -c plotly plotly
In this tutorial, we will be using Ploly Gannt/Timeline chart. We can use it to process tasks/jobs data against time and can visualize each task on chart. We start with a basic chart and then proceed with different options provided by ploty.
Create a Gantt Chart
Plotly accepts data using pandas DataFrame, so you may need to install for usage with plotly. Lets first create a pandas DataFrame which then we will use for creating gantt charts. Our dataframe consists of three columns as Task title, start and finish date of that task.
import pandas as pd
# create a dataframe using 3 columns
df = pd.DataFrame([
    dict(Task="Market Research", Start='2021-01-20', Finish='2021-02-04'),
    dict(Task="Create App design", Start='2021-02-05', Finish='2021-02-28'),
    dict(Task="Build Application", Start='2021-03-01', Finish='2021-04-15'),
    dict(Task="Application Testing", Start='2021-04-10', Finish='2021-04-22'),
    dict(Task="Deployment", Start='2021-04-22', Finish='2021-04-25')
])
Now, we can specify these details to plotly for creating a gantt chart. We specify start and finish time for chart and on y axis, we show task details for each task.
import plotly.express as px
# create gantt/timeline chart.
fig = px.timeline(df, x_start="Start", x_end="Finish", y="Task")
# shows charts in reversed, so last row of dataframe will show at bottom
fig.update_yaxes(autorange="reversed")
fig.show()
As we can see, we have a horizontal bar for each chart starting on that given date period.
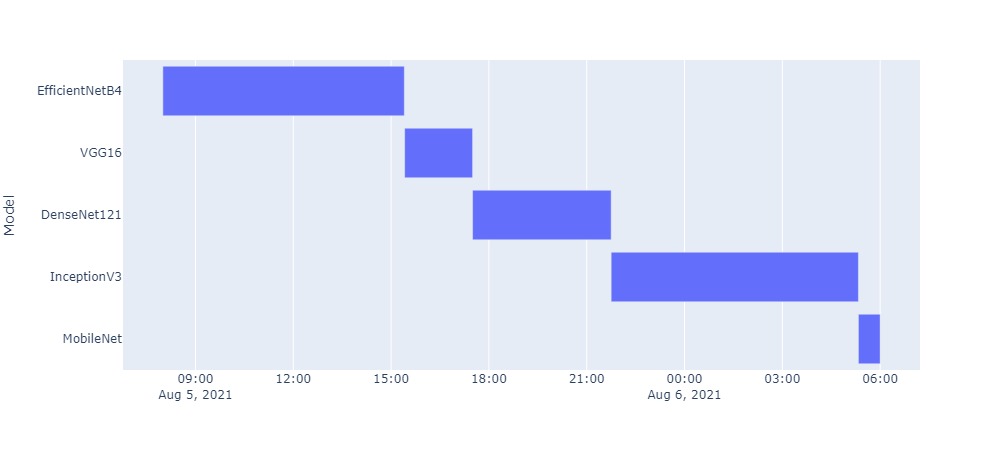
Instead of using just date, we can also specify time with date if we have data according to hours and days. So, lets create a new DataFrame for this which calculates Deep Learning models start and end time for training a specific dataset. So, lets create a dataframe for this.
# create a dataframe using time with date
dl_df = pd.DataFrame([
    dict(Model="EfficientNetB4", Start='2021-08-05 08:00:00', Finish='2021-08-05 15:24:21'),
    dict(Model="VGG16", Start='2021-08-05 15:25:00', Finish='2021-08-05 17:30:00'),
    dict(Model="DenseNet121", Start='2021-08-05 17:30:00', Finish='2021-08-05 21:45:00'),
    dict(Model="InceptionV3", Start='2021-08-05 21:45:00', Finish='2021-08-06 05:20:00'),
    dict(Model="MobileNet", Start='2021-08-06 05:20:00', Finish='2021-08-06 06:00:00')
])

# visualize
fig = px.timeline(dl_df, x_start="Start", x_end="Finish", y="Model")
# shows charts in reversed, so last row of dataframe will show at bottom
fig.update_yaxes(autorange="reversed")
fig.show()
Plotly offers different arguments in timeline method which are very useful and we can specify how our chart will look and work.
Gantt Chart Options
We can specify different options to timeline method, lets discuss them with examples.
Height and Width
We can specify height and width of chart in pixels so that we can have chart of desired shape. Changing height also help to increase or decrease width of horizontal bar.
# create chart with 1000 width and 450 height
fig = px.timeline(dl_df, x_start="Start", x_end="Finish", y="Model", width=1000, height=450)
Color
For each task, we can generate random colors which helps to identify tasks and also helps if there are same task at different timeline.
# You can specify any column from dataframe in color
# ex: if you have a seperate column for task details, we can specify that.
fig = px.timeline(dl_df, x_start="Start", x_end="Finish", y="Model", width=1000, height=450, color="Model")
Now we can see, it has specifed each model a color and also legend on right side.
Title and Text
We can specify overall timeline title using title argument and can also specify a text filed which will show on each bar.
fig = px.timeline(dl_df, x_start="Start", x_end="Finish", y="Model",
                  color="Model", text="Model", title="Model Training Timeline",)
For this example, it will show model name on each bar chart in this timeline.
Hover Data
When visualizing in a web application, we can show some data on hover and we can specify columns we want to show while creating gantt chart. For this example, we add a new column of duration which we will show on each bar.
# compute duration and add new column
dl_df['Duration'] = pd.to_datetime(dl_df['Finish']) - pd.to_datetime(dl_df['Start'])
# Get only hours
dl_df['Duration'] = dl_df['Duration'].astype(str).map(lambda x: x[7:])

# add another column of accuracy
dl_df['Accuracy'] = ["98%", "85%", "83%", "91%", "78%"]
Now we will create a gantt chart with duration as text and some data on hover.
fig = px.timeline(dl_df, x_start="Start", x_end="Finish", y="Model", width=900, height=450,
                  color="Model", text="Duration", title="Model Training Timeline",
                 hover_data=['Model', 'Start', 'Finish', 'Duration', 'Accuracy'])
This is an interactive chart, you can hover over any bar and it will display all details for that specific bar. We can also show multiple bar in same line at different time.
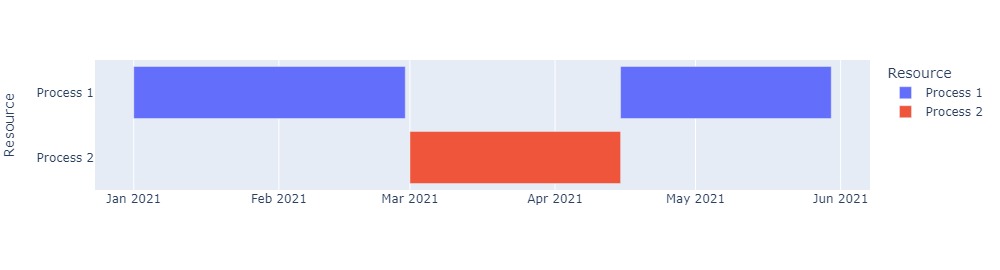
Show Multiple Bar in Same Timeline
For some tasks, we may have some sub tasks which start at some specific time, so we can show multiple bar charts in same timeline. For example, for given dataset we have 3 process for 2 tasks, process 3 (sub process of task 1) starts after task 2 is completed.
df = pd.DataFrame([
    dict(Task="Task 1", Start='2021-01-01', Finish='2021-02-28', Resource="Process 1"),
    dict(Task="Task 2", Start='2021-03-01', Finish='2021-04-15', Resource="Process 2"),
    dict(Task="Task 3", Start='2021-04-15', Finish='2021-05-30', Resource="Process 1")
])

fig = px.timeline(df, x_start="Start", x_end="Finish", y="Resource", color="Resource")
fig.show()
So, we can view in output, that it shows two bars in same task.
Plotly has a lot of other features for using charts and to display or export in different format.
We can use plotly gantt/timeline chart for job timeline visualization, visualization of tasks etc. For more details on plotly chart visualization, view details at this url.