Box plots are a great way to check statistical distribution of data with its quartiles. In this tutorial, we will work with plotly to plot box plots in data and its different features and options that we can use with plotly.
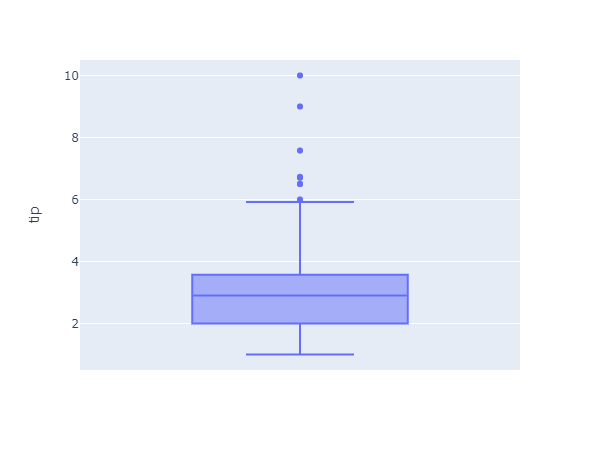
Plotly offers dataset examples that can be used to explore plotly features for testing and understanding. That data can be utilized using plotly data object. Lets check an example to plot box plot for single column using plotly data.
import plotly.express as px
df = px.data.tips() # load plotly tips data
fig = px.box(df, y="tip")
fig.show()
Which creates a nice box plot with min, max, median and all quartiles.
 In this tutorial, we will be using opensource dataset to explore features of plotly for plotting boxplots using custom dataset. We first read dataset from csv file using pandas and lets plot single column using plotly.
import pandas as pd
import plotly.express as px
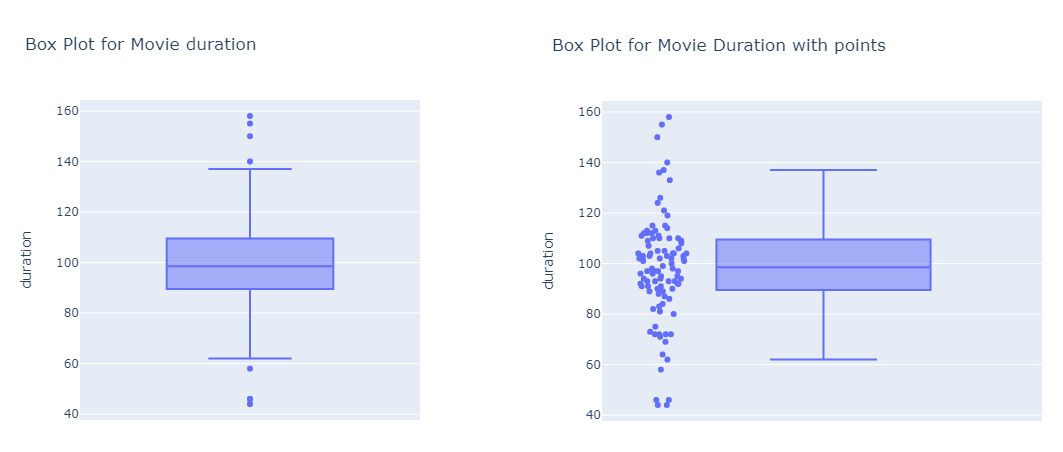
df = pd.read_csv("datasets/netflix.csv")Now we create a box plot for movies duration(minutes). We can also view all points for given box plot along with given box.
# box plot for movies duration
px.box(df, y="duration", title="Box Plot for Movie duration")

# box plot for movies duration with points along box
px.box(df, y="duration", title="Box Plot for Movie Duration with points", points="all")
Here is the output for both plots from left to right for given code.
With plotly, we can also provide x-axis column where it will create each box plot for all value in that column. For this attribute, we need to define both x column and color column (which also could be x column for this example). Here will will create a interactive box plot with specified width and other data.
duration_box = px.box(
    df, # dataframe input
    y="duration", # movie duration
    x="release_year", # release year
    color="release_year", # color by release year
    title="Box Plot for Movie Duration with release year", # tilte
    points="all", # draw points as well with box plot
    width=900 # width of the plot
)
# show plot
duration_box.show()

# we can also export it as an image
duration_box.write_image("images/output.png")
There are other different styling options and features available for creating box plots using plotly. For more details, you can check documentation on plotly official page.