Python Docx can create table with different data and also can use multiple styles for table. In previous post, we created basic tables and nested table with images and text data. In this post, we create tables using csv and xlsx files. Dataset files for these examples are downloaded from kaggle.
CSV to Docx
In this example, we are using titanic dataset and we will use pandas to read csv file and get data. So, first we read dataset file and extract columns that we want to display.
import pandas as pd
# read csv file
titanic_df = pd.read_csv('titanic.csv')
# display some rows
titanic_df.head(7)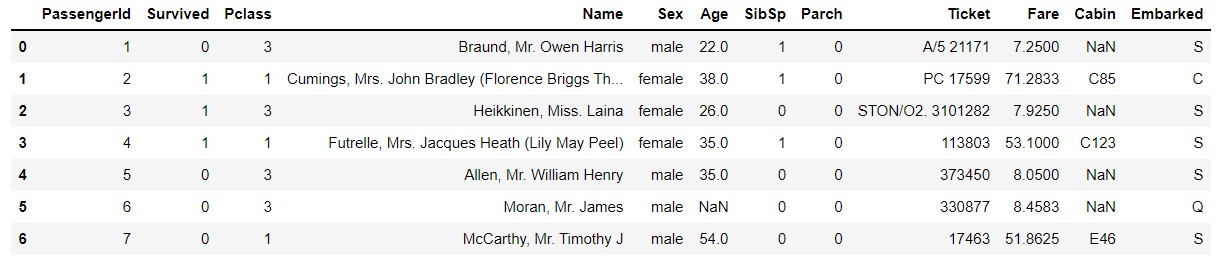
For this example, we will not display all columns, we just show add some columns to table in docx.
# slice specific columns
titanic_df = titanic_df[['Name', 'Sex', 'Age', 'Ticket', 'Fare', 'Embarked']]
Now we can create a document using python docx and add data to document using table object. Lets first create a document. We also modify document to decrease left and right margin as table has multiple columns.
# import required packages
from docx import Document
from docx.shared import Mm
# create document
doc = Document()

# reduce left and right margin to 5mm (Optional)
section = doc.sections[0]
section.left_margin = Mm(5)
section.right_margin = Mm(5)
Now we add a table object to document with 1 row and columns equal to number of columns in DataFrame. We also iterate on column names list to add column names to table. In this example we specify set_cell_margins function to increase margin of each cell. View this code in this example. Working with tables in Python-Docx
columns = list(titanic_df.columns) # get columns list
# add table with 1 row and len(columns) columns
table = doc.add_table(rows=1, cols=len(columns), style="Medium Shading 2 Accent 1")
table.autofit = True # set autofit true
# add table headers using column list
for col in range(len(columns)):
    set_cell_margins(table.cell(0, col), top=100, start=100, bottom=100, end=50) # set cell margin
    table.cell(0, col).text = columns[col]
Now we can iterate on each row in dataframe and add to table. For this example, we just use 10 rows.
# iterate on dataframe (10 rows)
for i, row in enumerate(titanic_df.iloc[:10].itertuples()):
    table_row = table.add_row().cells # add new row to table
    for col in range(len(columns)): # iterate over each column in row and add text
        set_cell_margins(table_row[col], top=100, start=100, bottom=100, end=50)
        table_row[col].text = str(row[col+1]) # avoid index by adding col+1
# save document
doc.save("out.docx")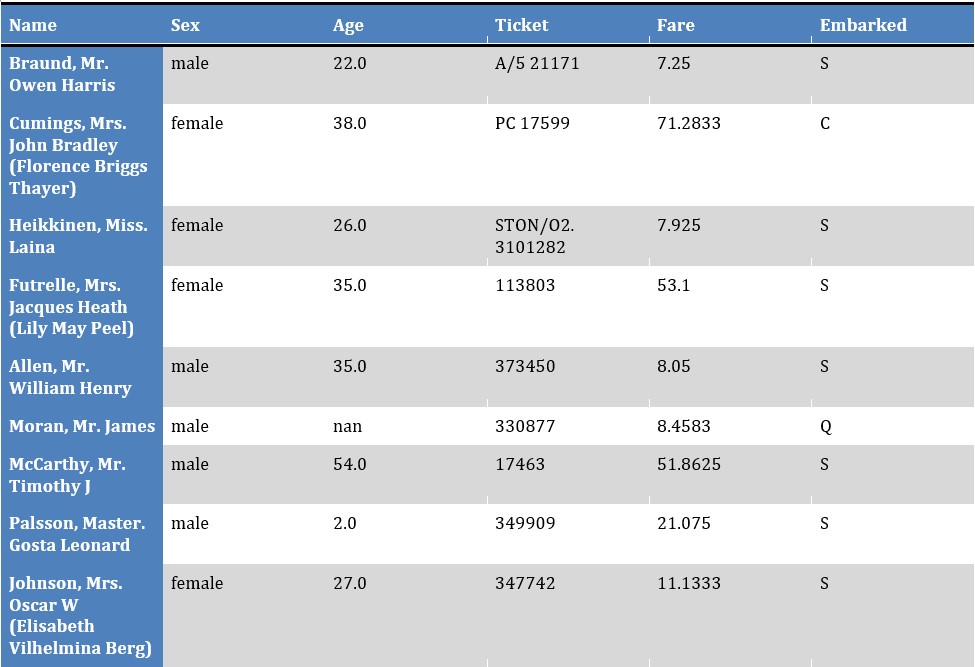
Excel to Docx
Excel data can also be processed same way as csv. In case of multiple sheets, we can select a sheet and iterate on its rows. In pandas we can use read_excel method to read xlsx files and then process them. We can convert above code to a python function and then can use it multiple times for adding multiple table objects to document.
from docx.enum.text import WD_ALIGN_PARAGRAPH

def add_table_to_doc(doc, df, heading, table_style='Table Grid'):
    """ Adds a table to a docx document """
    doc.add_heading(heading, level=1).paragraph_format.alignment = WD_ALIGN_PARAGRAPH.CENTER

    columns = list(df.columns)
    # add table
    table = doc.add_table(rows=1, cols=len(columns), style=table_style)
    table.autofit = True
    # add columns (if there is '_' then replace with space)
    for col in range(len(columns)):
        set_cell_margins(table.cell(0, col), top=100, start=100, bottom=100, end=50)
        table.cell(0, col).text = columns[col].replace("_", " ").capitalize()
    # add data
    for i, row in enumerate(df.itertuples()):
        table_row = table.add_row().cells
        for col in range(len(columns)):
            set_cell_margins(table_row[col], top=100, start=100, bottom=100, end=50)
            table_row[col].text = str(row[col+1])

    return doc
Now we can use this function multiple times to add tables to document.
from docx import Document
import pandas as pd
from docx.shared import Mm
# read xlsx file
hr_df = pd.read_excel('HR_Employee_Data.xlsx')
# select specific columns
hr_df = hr_df[['Emp_Id', 'satisfaction_level', 'number_project', 'average_montly_hours', 'left', 'time_spend_company', 'Department', 'salary']]
# create document and set properties
doc = Document()
section = doc.sections[0]
section.left_margin = Mm(5)
section.right_margin = Mm(5)
# add tables
add_table_to_doc(doc, hr_df.iloc[:5], 'HR Employee Data 1-5', 'Light Grid Accent 1')
# add second table
add_table_to_doc(doc, hr_df.iloc[10:15], 'HR Employee Data 10-15', 'Light Shading Accent 1')
# save to file
doc.save("hr_data.docx")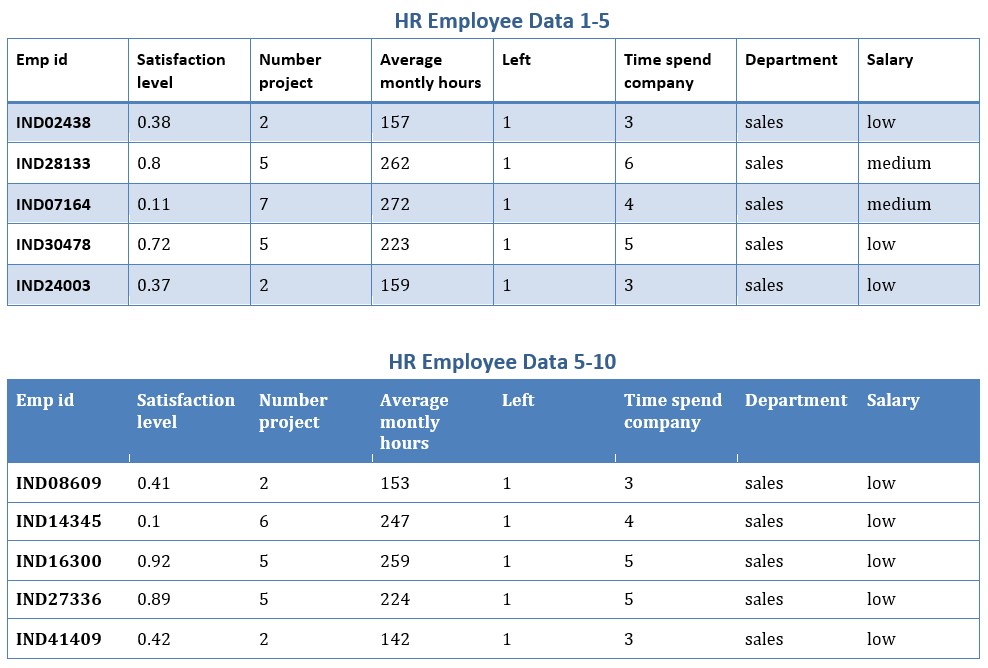 For more details on python docx and working with tables using python docx. View my previous post or view python-docx documentation.
- https://python-docx.readthedocs.io/en/latest/api/table.html
- https://mlhive.com/2022/04/working-with-tables-in-python-docx